8 Minute Read

When someone asks, “How much light do I need?” the answer cannot come from a fixture’s wattage or lumen rating alone. A successful lighting design must consider how much light a fixture produces, where it sends that light, how much reaches the work surface, how evenly it is distributed, and how bright the space appears to occupants.

That is why the lighting industry uses several lighting units and measurements. Lumens, candela, foot-candles, lux, luminance, watts, and luminous efficacy describe different parts of lighting performance. Understanding how these measurements work together helps facility managers compare fixtures, establish design criteria, and interpret a photometric report before purchasing equipment.

Key Takeaways

Lighting measurements are most useful when they are connected to the decisions made during fixture selection and layout design.

What should facility managers know when evaluating lighting measurements?

    • Lumens measure total light output, while foot-candles and lux measure the light that reaches a surface.
    • Candela describes how strongly a fixture sends light in a particular direction, which helps explain why fixtures with similar lumen packages can perform differently.
    • Watts measure power consumption, not visible light output; lumens per watt show how efficiently a fixture converts power into light.
    • Recommended foot-candle levels are starting points, not complete designs, because task difficulty, surface reflectance, uniformity, glare, and mounting conditions also matter.
    • A photometric report or layout connects fixture test data to the actual space and predicts whether the proposed design will meet project goals.

What Are the Different Lighting Measurements?

Lighting measurements answer different questions. Treating them as interchangeable can lead to a fixture that looks efficient on a specification sheet but performs poorly after installation.

Measurement

Unit

What It Describes

Design Question It Helps Answer

Electrical power

Watt (W)

Electricity consumed

How much power will the fixture draw?

Luminous flux

Lumen (lm)

Total visible light emitted

How much light leaves the fixture?

Luminous intensity

Candela (cd)

Light emitted in a specific direction

Where is the fixture concentrating its light?

Illuminance

Foot-candle (fc) or lux (lx)

Light arriving at a surface

How much light reaches the floor, desk, rack, or workplane?

Luminance

Candela per square meter (cd/m²), also called a nit

Light emitted or reflected from a surface toward the observer

How bright will a fixture or surface appear?

Luminous efficacy

Lumens per watt (lm/W)

Visible light output per watt used

How efficiently does the fixture produce light?

These relationships are the foundation of photometry, the measurement of visible light weighted to human visual response. Photometry differs from radiometry, which measures electromagnetic radiation without limiting the analysis to what people can see.

How Do Light Output and Direction Affect Fixture Selection?

Fixture output and distribution work together. Lumens indicate how much visible light is available, while candela shows how strongly that light is projected in a particular direction. Comparing either number alone can hide important differences between fixtures.

Lumens

Lumens measure fixture output. Foot-candles measure illuminance at a specific surface. In other words, lumens describe the light produced at the source, while foot-candles describe how much useful light arrives where people need it.

This distinction directly affects fixture selection. Two high bays may both produce 20,000 lumens, but one may use a narrow distribution that delivers more light to a warehouse floor from a high mounting point. The other may spread light more broadly and create better coverage at a lower mounting height. Their lumen ratings are equal, but their foot-candle patterns are not.

Distance also changes illuminance. For a point source, illuminance generally decreases according to the inverse-square relationship: doubling the distance can reduce illuminance to approximately one-quarter. Actual luminaires, optics, mounting angles, reflections, and obstructions make real projects more complex, so lumen totals alone cannot determine fixture count or spacing.


Put Lighting Measurements into Perspective

Understanding lighting units and measurements makes it easier to evaluate how a lighting system will actually perform. One important measurement is luminous efficacy, which shows how efficiently a light source converts energy into visible light and can help you compare lighting technologies and products more effectively.

Learn more about luminous efficacy, lighting efficiency, and the role lumens play in evaluating lighting performance, then tell us about your project. Our lighting experts can help you identify the right products and solutions for your specific application.

👉 Read: Luminous Efficacy (Lighting Efficiency) and the Power of "Lumens"

👉 Tell Us About Your Lighting Project


Candela

Candela measures luminous intensity in a particular direction. NIST identifies the candela as the SI base unit of luminous intensity. One lumen equals one candela multiplied by one steradian, a unit of solid angle.

In practical design, candela helps explain beam shape and optical control. A narrow-beam fixture can produce a high candela value and send light farther, while a wide-distribution fixture spreads its lumens across a larger area. Neither is automatically better. The correct distribution depends on mounting height, fixture spacing, aisle width, target surfaces, and spill-light limits.

Candela data are commonly presented in a polar intensity diagram. Longer plot lines indicate greater intensity at those angles. Designers use this information to see whether a luminaire throws light downward, outward, asymmetrically, or into angles that could create glare or wasted light.

How Is Light at a Surface Measured?

Illuminance describes how much light reaches a surface. Foot-candles and lux measure the same property using different area units, and both must be tied to a defined workplane to be meaningful.

Foot-Candles

One foot-candle equals one lumen distributed over one square foot:

1 fc = 1 lm/ft²

Foot-candles are commonly used in the United States to establish and verify lighting levels on floors, desks, workbenches, shelves, pavement, and other target surfaces. They do not describe a fixture's total output.

Lux

Lux is the International System of Units measurement for illuminance. One lux equals one lumen distributed across one square meter:

1 lx = 1 lm/m²

Foot-candles and lux measure the same property using different area units. The conversions are:

1 foot-candle = approximately 10.76 lux

1 lux = approximately 0.093 foot-candles

The difference between lux and lumens is therefore the same as the difference between foot-candles and lumens: lux measures light at a surface, while lumens measure total output from the source. A 10,000-lumen fixture does not create a fixed lux level because the result depends on distribution, distance, orientation, room geometry, and surface reflectance.

Measuring Foot-Candles

Foot-candles are measured with a calibrated light meter placed at the surface or workplane being evaluated. The sensor should face the specified direction, and the person taking the reading should avoid casting a shadow on it.

The measurement plane must match the space's purpose. A warehouse may be evaluated horizontally at floor level for circulation and vertically on rack faces for labels. An office is usually evaluated at desktop height. A parking lot is typically measured on the pavement, while a sports facility may require horizontal and vertical readings for players, spectators, or cameras.

A single reading is rarely enough. Designers use a grid of calculation or measurement points to evaluate:

    • Average illuminance across the area
    • Minimum illuminance at the lowest point
    • Maximum illuminance at the highest point
    • Uniformity ratios, such as average-to-minimum or maximum-to-minimum

Average foot-candles can meet a target even while dark pockets remain between fixtures. That is why the minimum value and uniformity ratio can be as important as the average.

How Many Foot-Candles Are Needed in Warehouses and Offices?

No universal foot-candle requirement applies to every warehouse or office. Lighting criteria should reflect the visual task, occupant needs, applicable codes, and the current recommendations for the application. ANSI/IES RP-7 addresses industrial facilities, while ANSI/IES RP-1 addresses office lighting.

The following ranges are useful planning examples, not a substitute for a project-specific design or the applicable standard:

Application

Illustrative Maintained Illuminance

Why the Range May Change

Inactive warehouse storage

5–10 fc / 50–100 lx

Limited activity may need only basic visibility and circulation lighting.

Active storage with large items

10–20 fc / 100–200 lx

Aisle geometry, lift traffic, and product size affect the target.

Picking, packing, or small-label work

20–50 fc / 200–500 lx

Small print, low contrast, vertical rack faces, and task speed can require more light.

General office work

30–50 fc / 300–500 lx

Screen use, paper tasks, daylight, glare, and employee demographics influence the design.

The word “maintained” matters. LED output declines over time, and dirt can reduce delivered light. A lighting layout should account for an appropriate light-loss factor so the system continues to meet the intended level between maintenance cycles, rather than only when it is new.


How Do Lighting Measurements Affect Efficiency and Visual Quality?

Energy performance and visual performance are related, but they are not interchangeable. Watts and efficacy help evaluate electrical efficiency, while luminance helps explain how bright a surface or source appears to an observer.

Watts

A watt (W) measures electrical power consumption. They help estimate connected load and energy use, but they do not indicate how much visible light a fixture produces or whether that light reaches the intended surface. When comparing LED products, review wattage alongside lumen output, distribution, controls, and the proposed layout.

Luminous Efficacy

Luminous efficacy is the ratio of lumen output to power input, expressed in lumens per watt:

Luminous efficacy = lumens ÷ watts

For example, a 15,000-lumen fixture drawing 100 watts has an efficacy of 150 lm/W. A second fixture producing 15,000 lumens at 125 watts has an efficacy of 120 lm/W.

The first fixture converts electricity into visible light more efficiently, but efficacy does not prove that it is the better design choice. A highly efficient fixture can still create poor uniformity, excessive glare, inadequate vertical illumination, or light outside the target area. Evaluate efficacy alongside distribution, delivered illuminance, controls, color quality, thermal conditions, rated life, and total project cost.

Luminance

Illuminance measures light arriving at a surface. Luminance describes light leaving or reflecting from a surface toward the viewer, so it more closely relates to what the eye perceives as bright.

Surface characteristics create the difference. A dark warehouse floor and a white office wall can receive the same illuminance but reflect very different amounts of light. High-reflectance ceilings and walls can make a room feel brighter and improve light distribution. Conversely, a small high-luminance source within a darker field of view can produce discomfort glare even when measured foot-candles are acceptable.

This is why a complete lighting design considers more than a horizontal average. Fixture shielding, viewing angles, vertical illuminance, surface reflectance, and luminance contrast influence comfort, visibility, and the perceived quality of the space.

Correlated Color Temperature (CCT)

Correlated color temperature describes the color appearance of white light and is measured in kelvins (K). Lower values, such as 2700K or 3000K, typically produce a warmer appearance, while higher values, such as 4000K or 5000K, appear cooler.

CCT does not measure light output, brightness, or energy efficiency. Instead, it helps designers set a space's atmosphere, coordinate lighting across a facility, and support the activities performed there. Warmer light is often used in hospitality and dining environments, while cooler light is common in warehouses, offices, and other task-oriented spaces. However, the appropriate CCT depends on the application, surrounding finishes, brand standards, and occupant expectations.

Color Rendering Index (CRI)

Color Rendering Index measures how accurately a light source reveals the colors of objects compared with a reference light source. CRI is reported on a scale with a maximum value of 100. In general, a higher CRI indicates more faithful color rendering.

CRI affects how merchandise, food, finishes, skin tones, labels, wiring, and safety markings appear under electric lighting. An 80+ CRI may suit many general commercial and industrial applications, while retail, hospitality, healthcare, inspection, and other color-sensitive environments may benefit from a CRI of 90 or higher.

CRI should not be evaluated by itself. Two light sources with the same general CRI can render individual colors differently. Designers should consider the visual task, CCT, spectral characteristics, fixture performance, and any application-specific color requirements when selecting a light source.

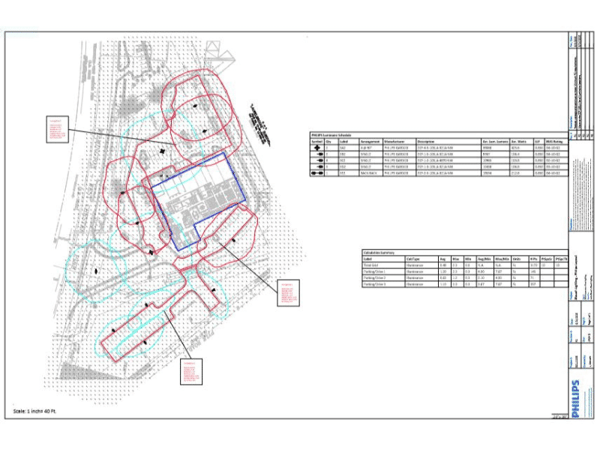
How Do You Read a Lighting Photometric Report?

A luminaire photometric test report describes how a specific fixture performs under controlled test conditions. An IES file contains digital intensity data that lighting software can use to model that fixture inside a project. The U.S. Department of Energy’s CALiPER program shows how photometric testing evaluates luminaire performance under defined conditions in its report on white-tunable LED luminaires.

When reviewing fixture data or a project photometric layout, check the following:

    • Confirm the exact fixture configuration. Output, wattage, optic, CCT, drive current, and mounting option should match the proposed product.
    • Review the light distribution. Use the candela plot or distribution classification to understand where the fixture sends light.
    • Locate the calculation grid and workplane. Verify that points are calculated at the floor, desk, rack face, or other relevant surface.
    • Compare average, minimum, and maximum illuminance. Do not approve a layout from average foot-candles alone.
    • Check uniformity. Large differences between bright and dark areas can affect visibility and perceived quality.
    • Review assumptions. Mounting height, fixture tilt, room dimensions, reflectances, obstructions, and light-loss factors should reflect field conditions.
    • Look beyond the property or task boundary. Exterior layouts should also address spill light and glare where applicable.

A photometric layout is a prediction, not a guarantee, and is independent of field conditions. Changes to mounting height, fixture model, optics, room finishes, shelving, or equipment can change the results. The installed project should therefore match the approved layout as closely as possible.

Frequently Asked Questions About Lighting Measurements

Can a Smartphone App Measure Foot-Candles Accurately?

A phone app may help identify rough differences, but it should not replace a calibrated light meter for commissioning, compliance, or performance verification. Phone sensors and diffusers vary, and their readings may not respond accurately across different light sources and angles.

What Is a Light-Loss Factor in a Photometric Layout?

A light-loss factor reduces initial calculated output to estimate maintained conditions. It may account for LED lumen depreciation, dirt accumulation, and other project-specific losses. Document the selected factor and ensure it fits the fixture, environment, and maintenance plan.

Why Can Two Surfaces With the Same Foot-Candles Look Different?

Color, texture, reflectance, surrounding contrast, and viewing direction affect the light returned to the eye. Equal illuminance does not guarantee equal luminance or perceived brightness.

Turn Lighting Measurements Into a Working Design

Lighting units become valuable when they are used together. Lumens describe the available output, candela shows how the optic directs it, foot-candles or lux quantify the light at the target, luminance helps explain visual brightness and glare, and watts and efficacy reveal energy performance. A photometric layout connects those measurements to the geometry and tasks of the actual facility.

Stouch Lighting is a national, manufacturer-neutral LED distribution and implementation company. We develop solution-oriented lighting packages around each facility’s performance goals, project conditions, upfront costs, warranty needs, and return on investment.